The latest release of INETCO Insight 5.2 includes many useful features to help IT Operations better understand the traffic on their network and troubleshoot issues they are seeing. One of the biggest changes in this application performance monitoring (APM) software is the ability to monitor transactions across many hops. By using a new data model, the Unified Transaction Model, you are able to correlate network messages with application and business data. This means that using INETCO Insight, you can now look at transactions in the context of application functions, end user activity and business goals.
As part of the UI Design and Web Application Group at INETCO, it is my job (with the input of our customers and team members) to design all the new features. One of the biggest challenges is figuring out how to display growing volumes of transaction data, network and application performance information in a way that it is easy to navigate, simple to understand and actionable, so that users can find the detailed information needed to solve problems quickly. Below I discuss the new and updated Transaction Detail Window and it’s new features.
The Transaction Detail Window is most commonly accessed through the Transaction Log. The Transaction Log in INETCO Insight 5.2 is an important tool for troubleshooting network problems and monitoring application performance, including failed transactions, incomplete transactions and slow response times. The Transaction Log lets users filter specific groups of transactions and look for specific individual transactions up to eight days in the past. The Transaction Log also displays a high level summary for each transaction. To get more information, users can click on any transaction to pull up its details in the Transaction Detail Window.
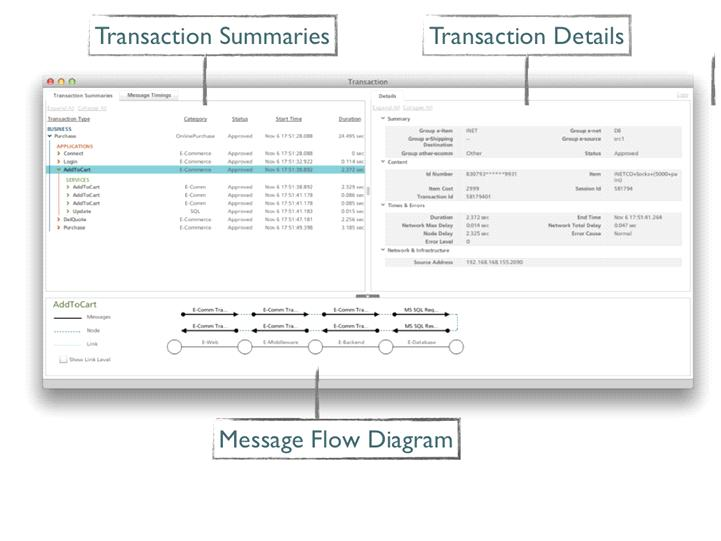
There are 4 areas in the Transaction Detail Window: Transaction Summaries, Message Timings, Transaction Details and the Message Flow Diagram.
Transaction Summaries
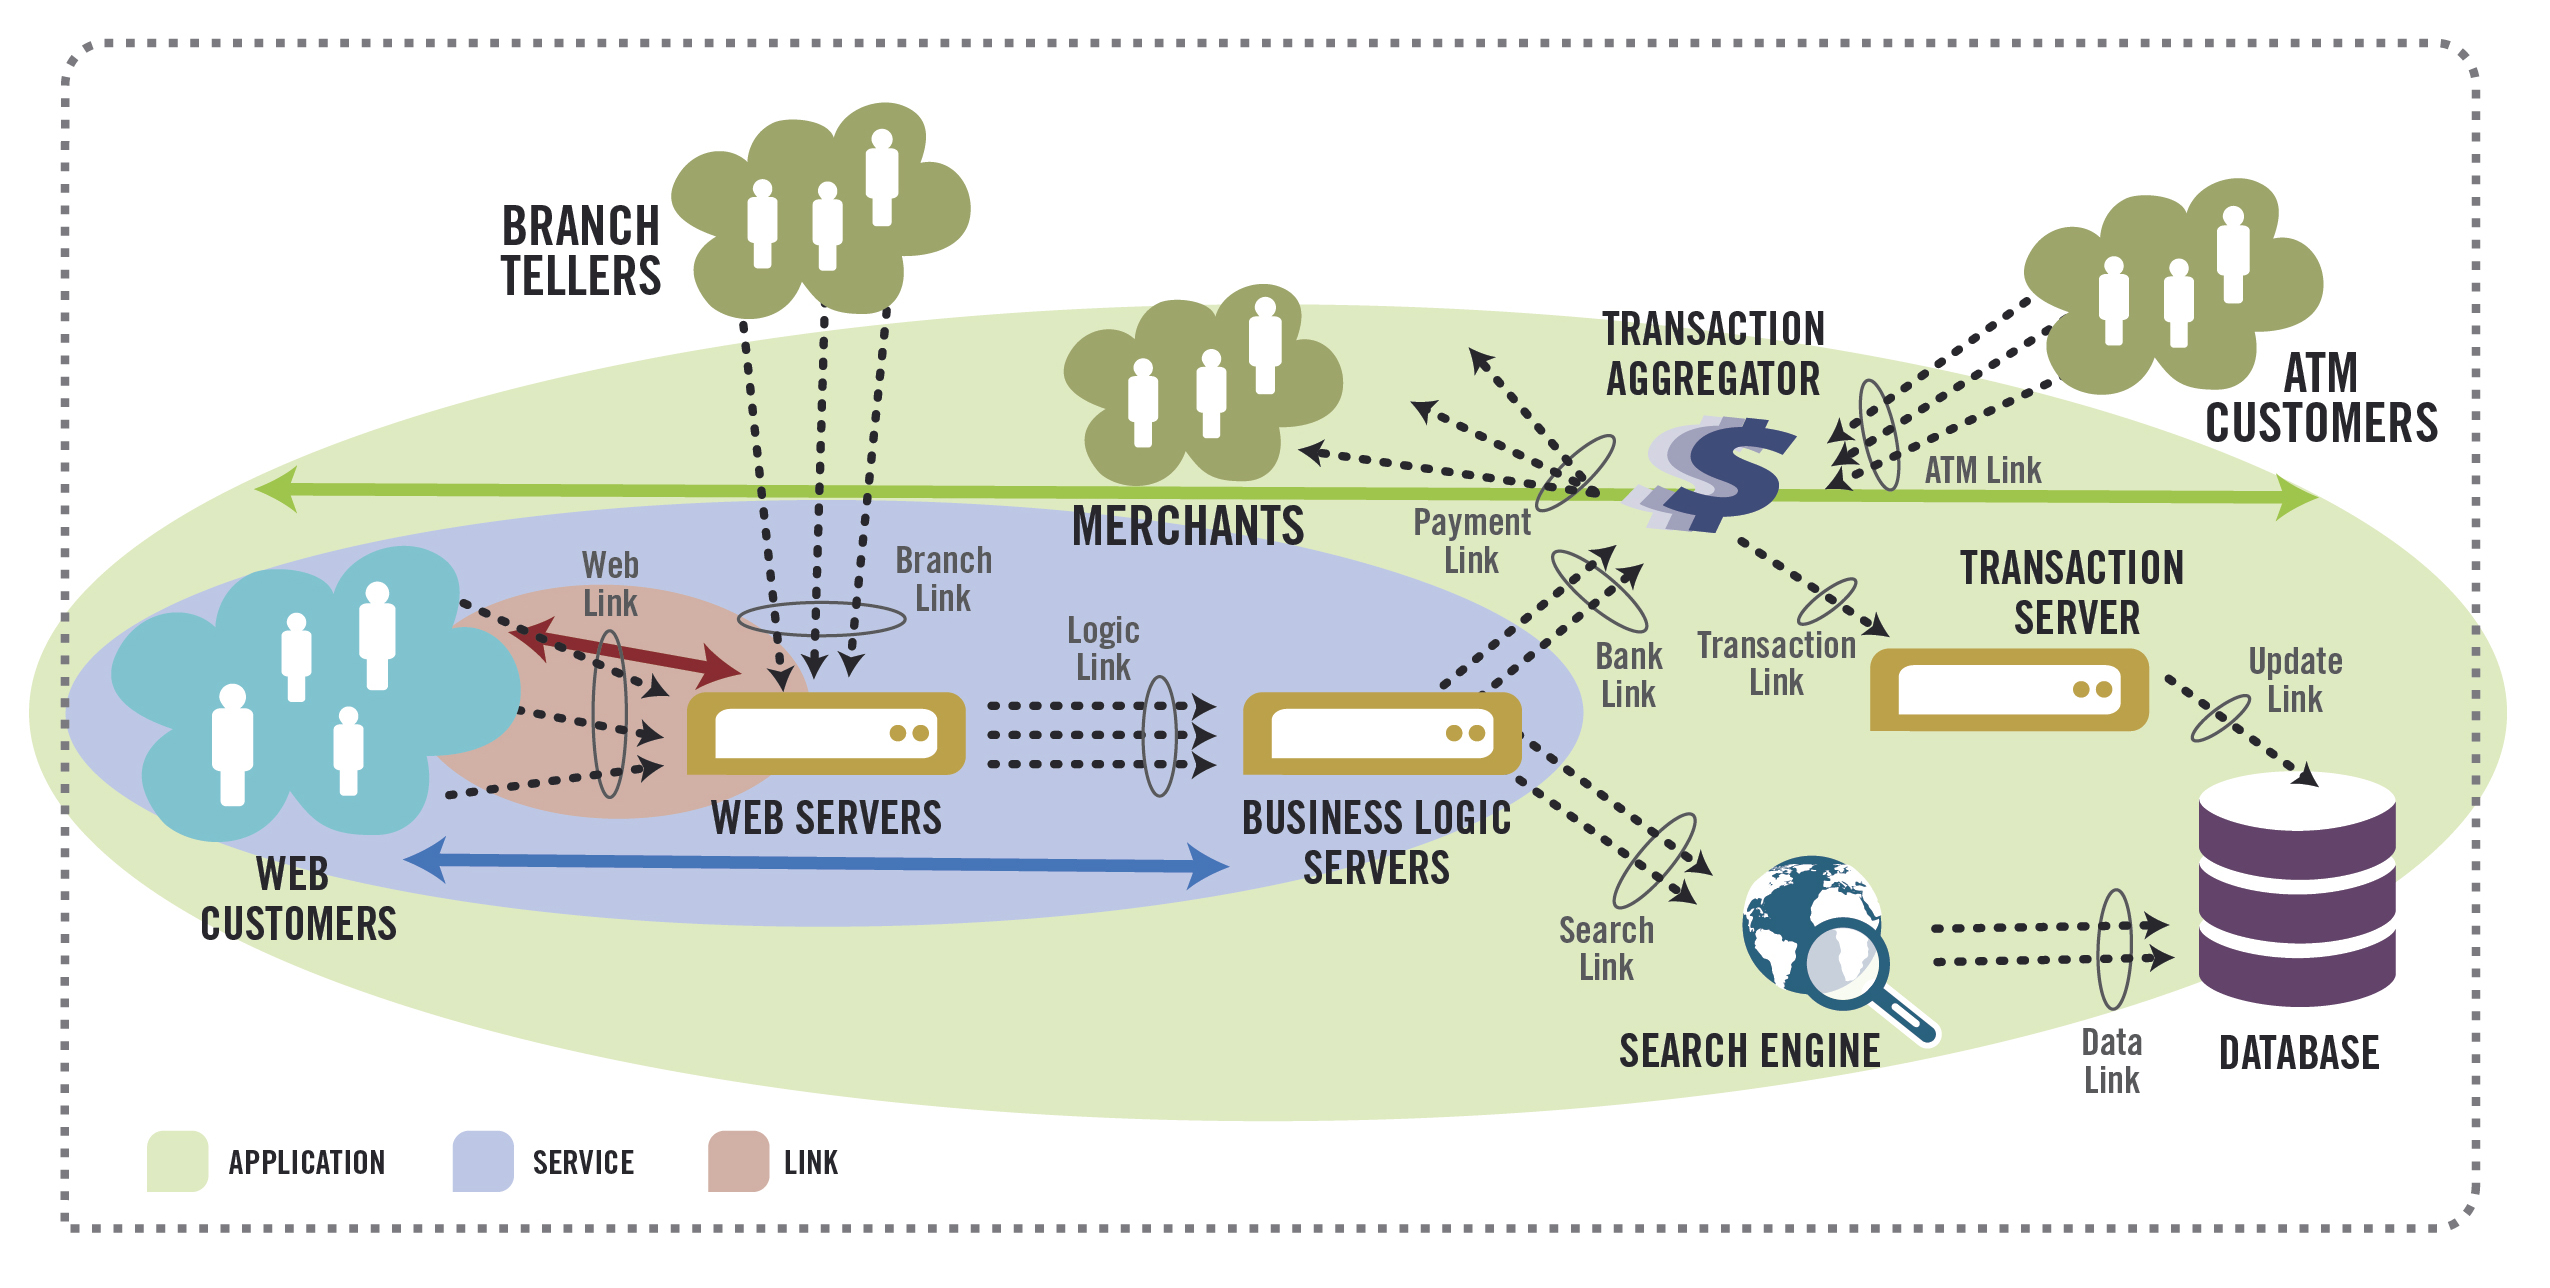
The Transaction Summaries view is organized in a tree structure where the layout of the transactions has the same structure as the Unified Transaction Model – Business, Applications, Services and Link transactions (see below).
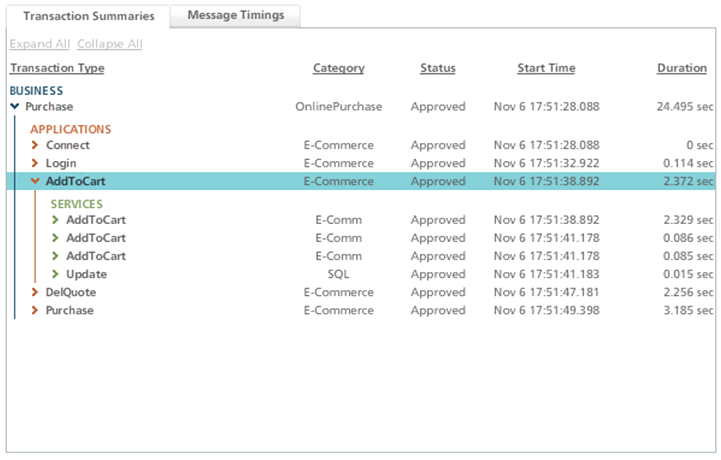
The view displays not only the transaction information for the transaction clicked on, but also displays that transaction in context of its Business and Application transactions. This enables users the ability to quickly view all the application transactions that were a part of a particular business transaction. Further, you can drill into these application transactions and see the Service and Link transactions as well.
In the above example, I clicked on the application transaction, “Add to Cart”. This transaction was a part of the Business transaction, “Purchase”, where an end user is making a purchase on an Ecommerce website. In the Transaction Summaries view, all of the steps that the end user completed to make the purchase on the website are displayed. These include connecting to the server (“Connect”), logging into their account (“Login”), adding something to their cart (“AddToCart”), getting a delivery quote (“DelQuote”), and finally purchasing their item using a credit card (“Purchase”). I have drilled down further into the “AddToCart” transaction to show each of the Service transactions that occurred to complete the “AddToCart” transaction. Each of these Service transactions occurred across a different hop in the network.
Transaction Summaries is designed so that the layers and details are not overwhelming, but are quickly available. Each layer of the tree has a specific color and using this color consistently in the arrows, lines and labels helps to organize the view for each layer. Grid lines and shading were intentionally left off this view so that it does not become cluttered and difficult to read. Hovering over a transaction with your mouse displays a highlighted bar over a summary line. The Category, Status, Start Time and Duration for each transaction is displayed so that users can quickly view any failed transactions or transactions that take a long time to complete.
Message Timings
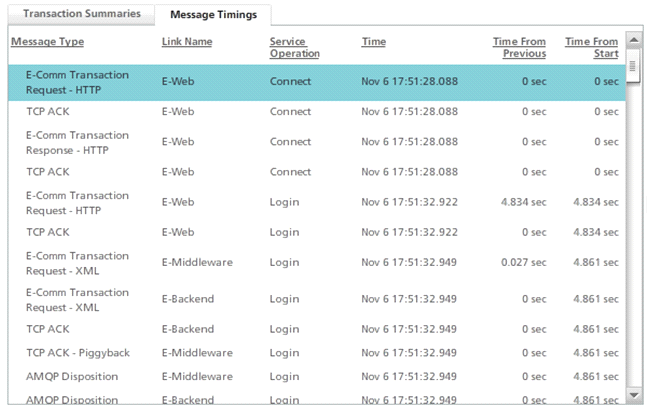
Beside the Transaction Summaries tab, the is the Message Timings tab where the individual message for each transaction is listed. The Message Type (i.e. Request, Response), the Link Name that the message is on, the Service Operation that the message is completing and Timing information is also displayed. The “Time From Previous” column lets users see which messages took the longest time to complete. In the below example we can see the Login, HTTP Request took the longest to complete at 4.834 seconds.
Transaction Details
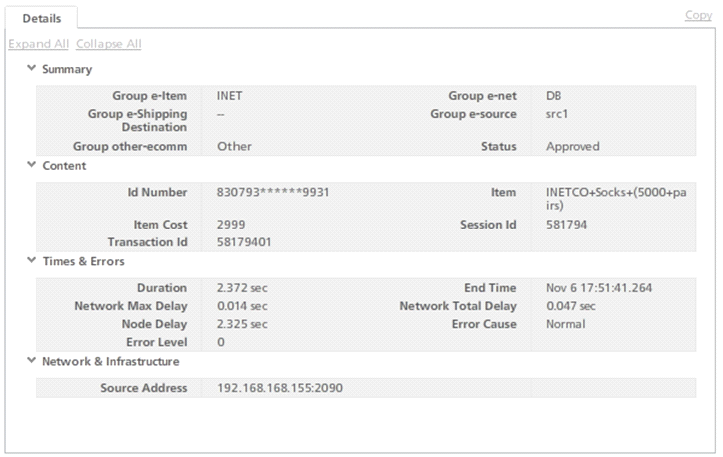
The Transaction Details tab on the right hand side of the Transaction Detail Window shows all of the transaction fields for the transaction highlighted on the left, in the Transaction Summaries view. These are organized into different categories, which can be expanded and collapsed.
Message Flow Diagram
The Message Flow Diagram at the bottom of the window shows how each message has travelled across the different links in the network to complete each Application transaction. When users click on an Application transaction in the Transaction Summaries window, a Message Flow Diagram for that transaction will appear. This view gives a visual representation of how a transaction’s messages flowed across your network nodes and Links. This view is useful when trying to see if there are any missing messages, or if the transaction did not reach a particular area in the network it should have gone to. For instance, you could see quickly that there was an issue with this transaction and no response received back from the database server.
Each node and Link in the message is drawn at the bottom of the diagram. The arrows indicate the direction of the message over the Link and each message is labeled with its operation. The order of the messages left to right is the order the messages actually occurred in the transaction. The blue dotted line indicates the message flowing across a configured node.
Clicking on the “Show Link Level” check box displays the Link level messages alongside the other messages. These are displayed in blue with a dotted line. These could be acknowledgement messages, control messages, or other types of network level messages. The link messages may be important to problem solving a particular issue. For instance, if a ACK was not sent back and one was expected.
By combining multiple views of the data, users are quickly access any detail they need for troubleshooting problems on their network. Not only is there network level details, the Transaction Details view displays Application and Business relevant information so users can better understand the impact of any problem transactions and where in the application these are being effected.
To learn more about the various features and functionality in INETCO Insight 5.2, register for INETCO’s upcoming webinar being held November 29th at 7am PST and 3pm PST.
You can also join Scott Chapman of American Electric Power and Nicole Arksey of INETCO as they present their paper on “Better Information Data Visualization” at the Computer Measurement Group Conference being held December 3-7, 2012 at the Rio All Suites in Las Vegas, NV. This session will be held on Tuesday, 1:15 PM – 2:15 PM in the Brasilla 1/4 Room (Session 331, Paper 1035)


